
 Introduces Ignite, an Automated Launchpad for Ecosystem Discovery")


Ethereum remains locked in a sideways structure, trading just below the psychological $3k mark.
Despite multiple attempts, buyers have struggled to generate follow-through momentum.
The recent price action reflects a market caught in indecision, with weakening bullish conviction and no real dominance from sellers. Meanwhile, on-chain data is starting to stir, hinting that the next move could be brewing beneath the surface.
Technical Analysis
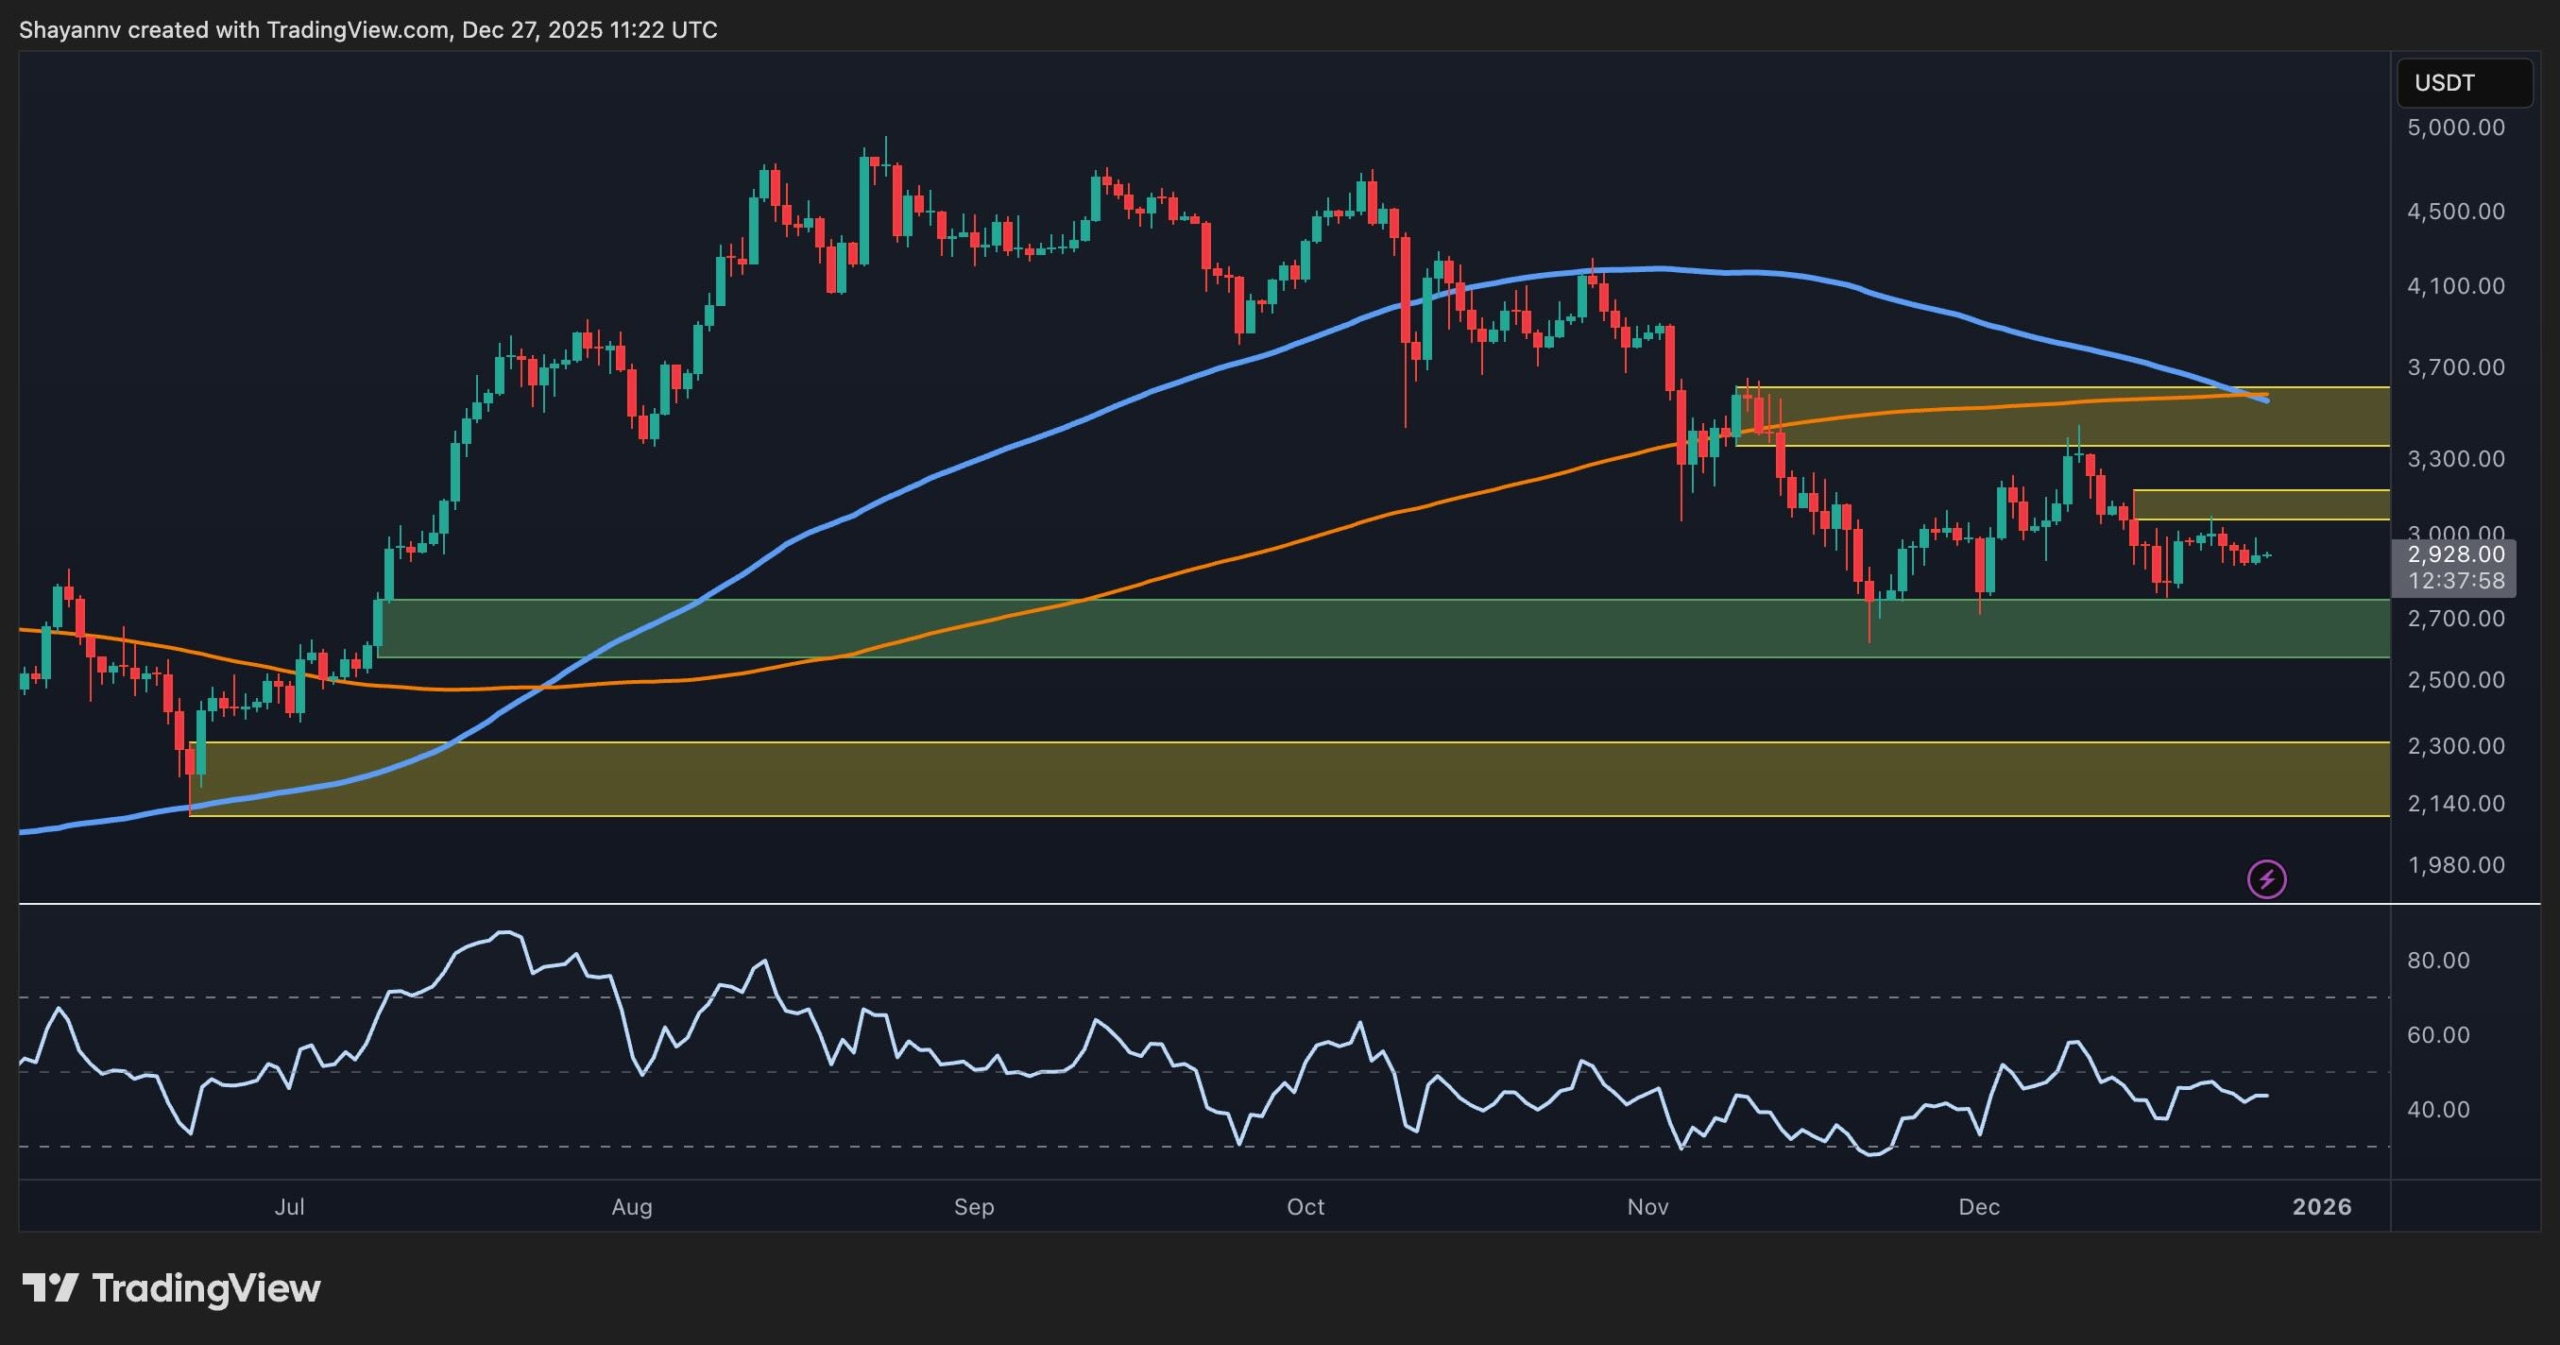
The Daily Chart
On the daily chart, ETH continues to consolidate between the $2,700 support zone and the $3,300 resistance, with price hovering around $2,970 at the time of writing.
The 200-day EMA (orange) and 100-day EMA (blue) continue to act as dynamic overhead resistance and have also printed a bearish crossover. This makes them a key confluence zone just above $3,300, where the price was previously rejected.
The RSI also remains below the midline, suggesting no momentum shift yet in favor of buyers. A close below $2,700 would likely trigger a retest of the $2,200 macro demand area, while reclaiming $3,300 could open the door toward $3,700 and beyond.
For now, the market lacks a catalyst strong enough to break out of this compression.

The 4-Hour Chart
Zooming into the 4H chart, ETH is still respecting the local trading zone between $2,800 and $3,000, moving sideways around the mid-range again.
Price action has been choppy, with failed breakouts both above and below, showing clear indecision from both sides.
The RSI has started climbing again, which could indicate some short-term upside, but without reclaiming the $3,000–$3,100 supply zone, buyers remain at a disadvantage.
If the price consolidates above $3,100 again with strength, a rotation back to the upper resistance at $3,300 could be expected, but the structure still favors range-bound trades as things stand.

On-Chain Analysis
Exchange Reserve
Ethereum’s exchange reserves have been trending down consistently for most of 2025, reflecting a long-term trend toward accumulation or self-custody. This has historically been interpreted as bullish, as fewer tokens on exchanges generally mean less sell pressure.
However, the recent chart shows a subtle but clear uptick in reserves, which is the first in months.
This could mean two things: either traders are preparing to cut their losses from recent consolidation, or larger players are repositioning ahead of a spike in volatility.
If this reserve build-up continues, it could point to increased potential for sell-side activity in the short term.
That said, one uptick doesn’t change the long-term accumulation trend yet. It is still important to monitor whether this is a one-off move or the beginning of a broader sentiment shift. If it is paired with price rejection at resistance and rising open interest, it could confirm preparation for downside positioning.

SECRET PARTNERSHIP BONUS for CryptoPotato readers: Use this link to register and unlock $1,500 in exclusive BingX Exchange rewards (limited time offer).
Disclaimer: Information found on CryptoPotato is those of writers quoted. It does not represent the opinions of CryptoPotato on whether to buy, sell, or hold any investments. You are advised to conduct your own research before making any investment decisions. Use provided information at your own risk. See Disclaimer for more information.