

Bitcoin price rebounded toward $63,900 on Aug. 3 after briefly falling near $62,300, but weak spot demand and fresh short-term holder losses continue to limit its recovery.
Summary
- Bitcoin price recovered to $63,894 after testing an intraday low of $62,300.
- The daily RSI remained neutral at 49.28, while the MACD showed weakening momentum.
- Short-term holders reportedly sent 32,000 BTC to exchanges at a loss within 24 hours.
- Liquidation liquidity is concentrated near $62,000 and $64,000, raising volatility risks.
Bitcoin price recovers from $62,300
According to data from crypto.news, Bitcoin (BTC) price traded at $63,894 at the time of writing, up 0.51% for the day after moving between $62,300 and $63,993.
The recovery followed a sharp decline toward $62,600 noted in Glassnode’s latest market report. According to the on-chain analytics firm, Bitcoin failed to hold its earlier move above $66,000 as weak spot demand and persistent net selling kept the market within a consolidation phase.
The daily chart shows that BTC has stabilized slightly above the 78.6% Fibonacci retracement level at $63,183. This area has acted as a short-term pivot since the beginning of July, with repeated price movements on both sides of it.
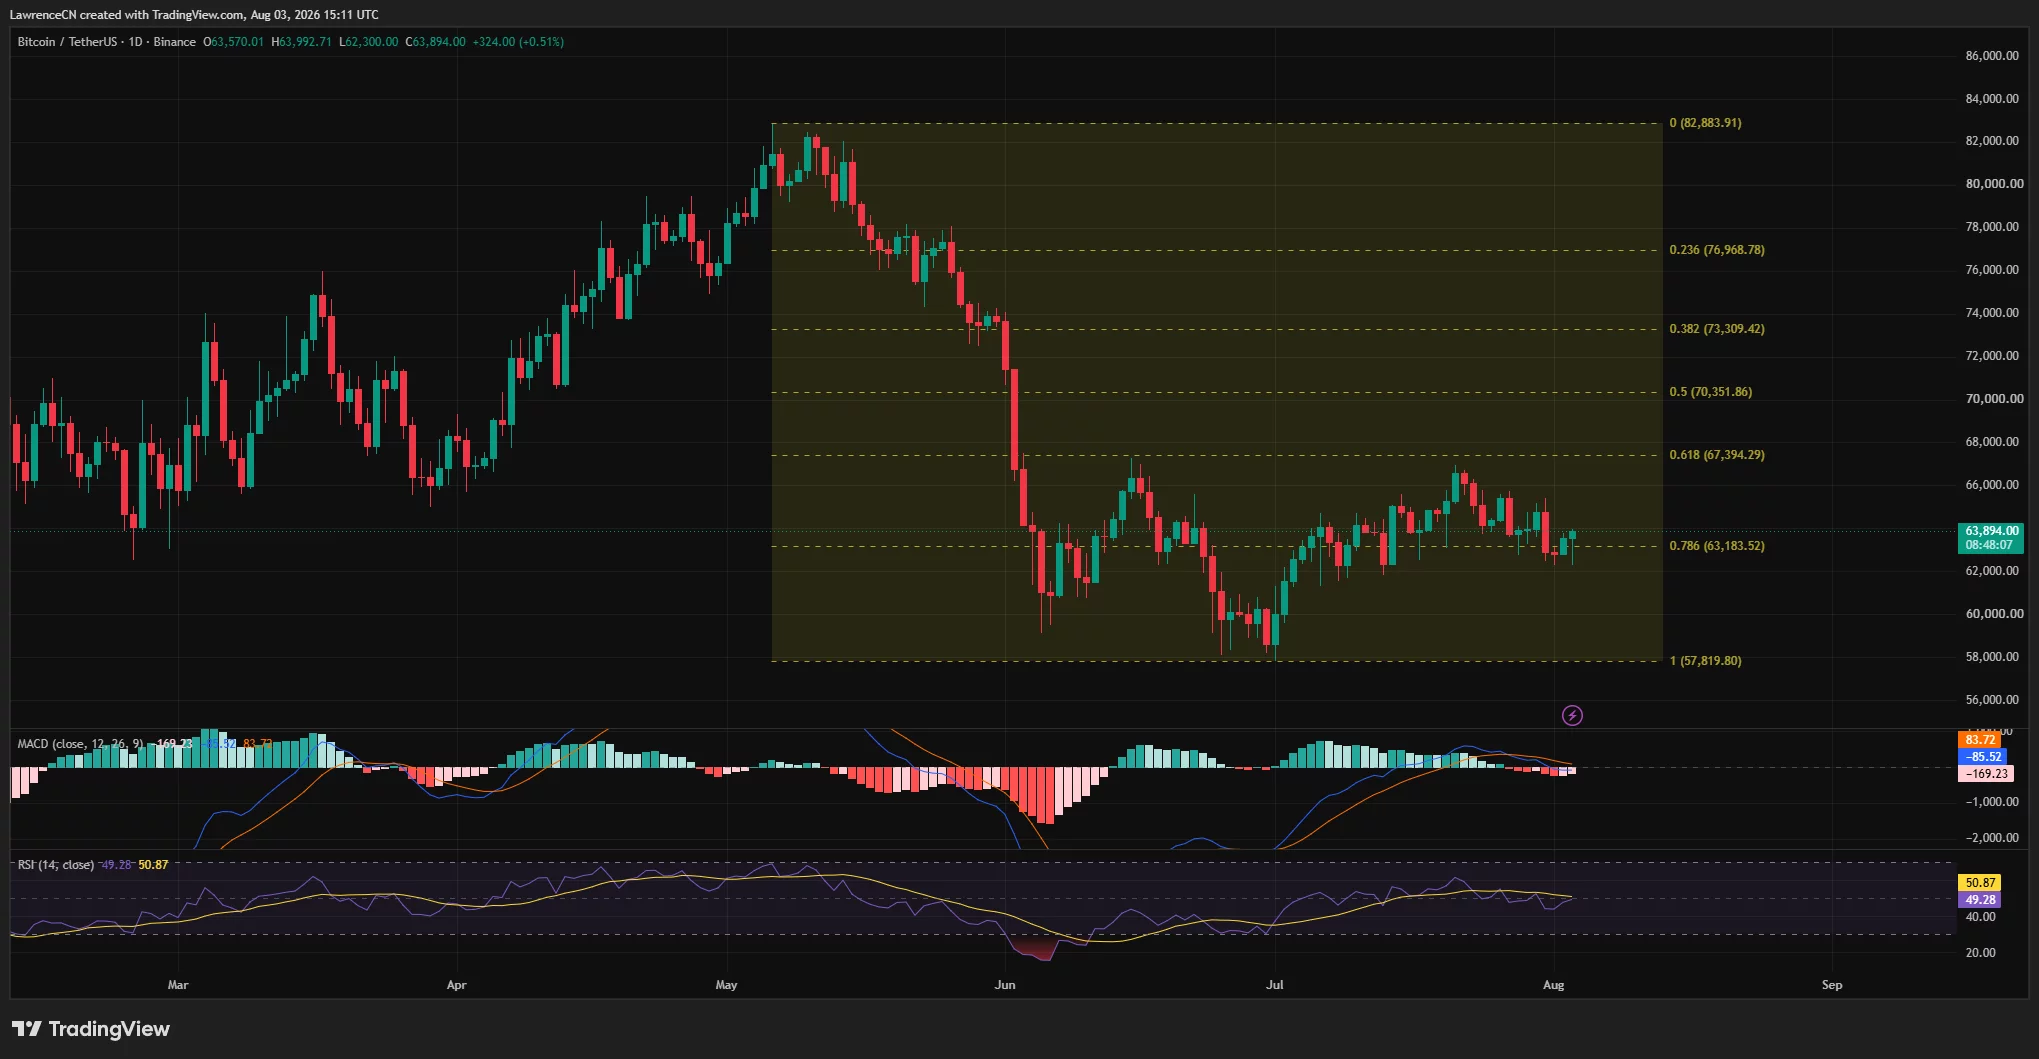
However, the rebound has not yet changed Bitcoin’s broader structure. BTC continues to trade below its July peak near $66,900 and remains well under the 61.8% Fibonacci retracement level at $67,394.
A daily close above $64,000 would strengthen the short-term recovery. Failure to hold $63,183 could expose Bitcoin to another test of the $62,000 region.
Short-term Bitcoin holders lock in losses
Selling by short-term holders appears to be adding pressure near the lower end of Bitcoin’s range.
A CryptoQuant chart shared by market observer Whale Factor showed that approximately 32,000 BTC reached exchanges at a loss within a single day. The account described the move as the largest short-term holder capitulation event in 30 days.
Transfers to exchanges do not confirm that every coin was sold. Still, coins moving from short-term holders at a loss can indicate defensive positioning or capitulation, particularly when prices are testing support.
Glassnode reported a similar deterioration in market profitability. The proportion of Bitcoin’s supply held in profit is approaching a cyclical low, while investor spending patterns increasingly reflect stop-loss activity.
Long-term holders have remained more resilient. Glassnode said the ratio of supply held by short-term holders relative to long-term holders remains near historical lows, indicating that older coins are not moving at the same rate.
Network activity has also increased. Daily active addresses and adjusted transfer volume moved above their recent statistical ranges, suggesting that Bitcoin’s latest volatility has been accompanied by greater on-chain usage.
Liquidation clusters put $62,000 and $64,000 in focus
CoinGlass’s three-day liquidation heatmap shows two major pools of leveraged positions surrounding Bitcoin’s current price.
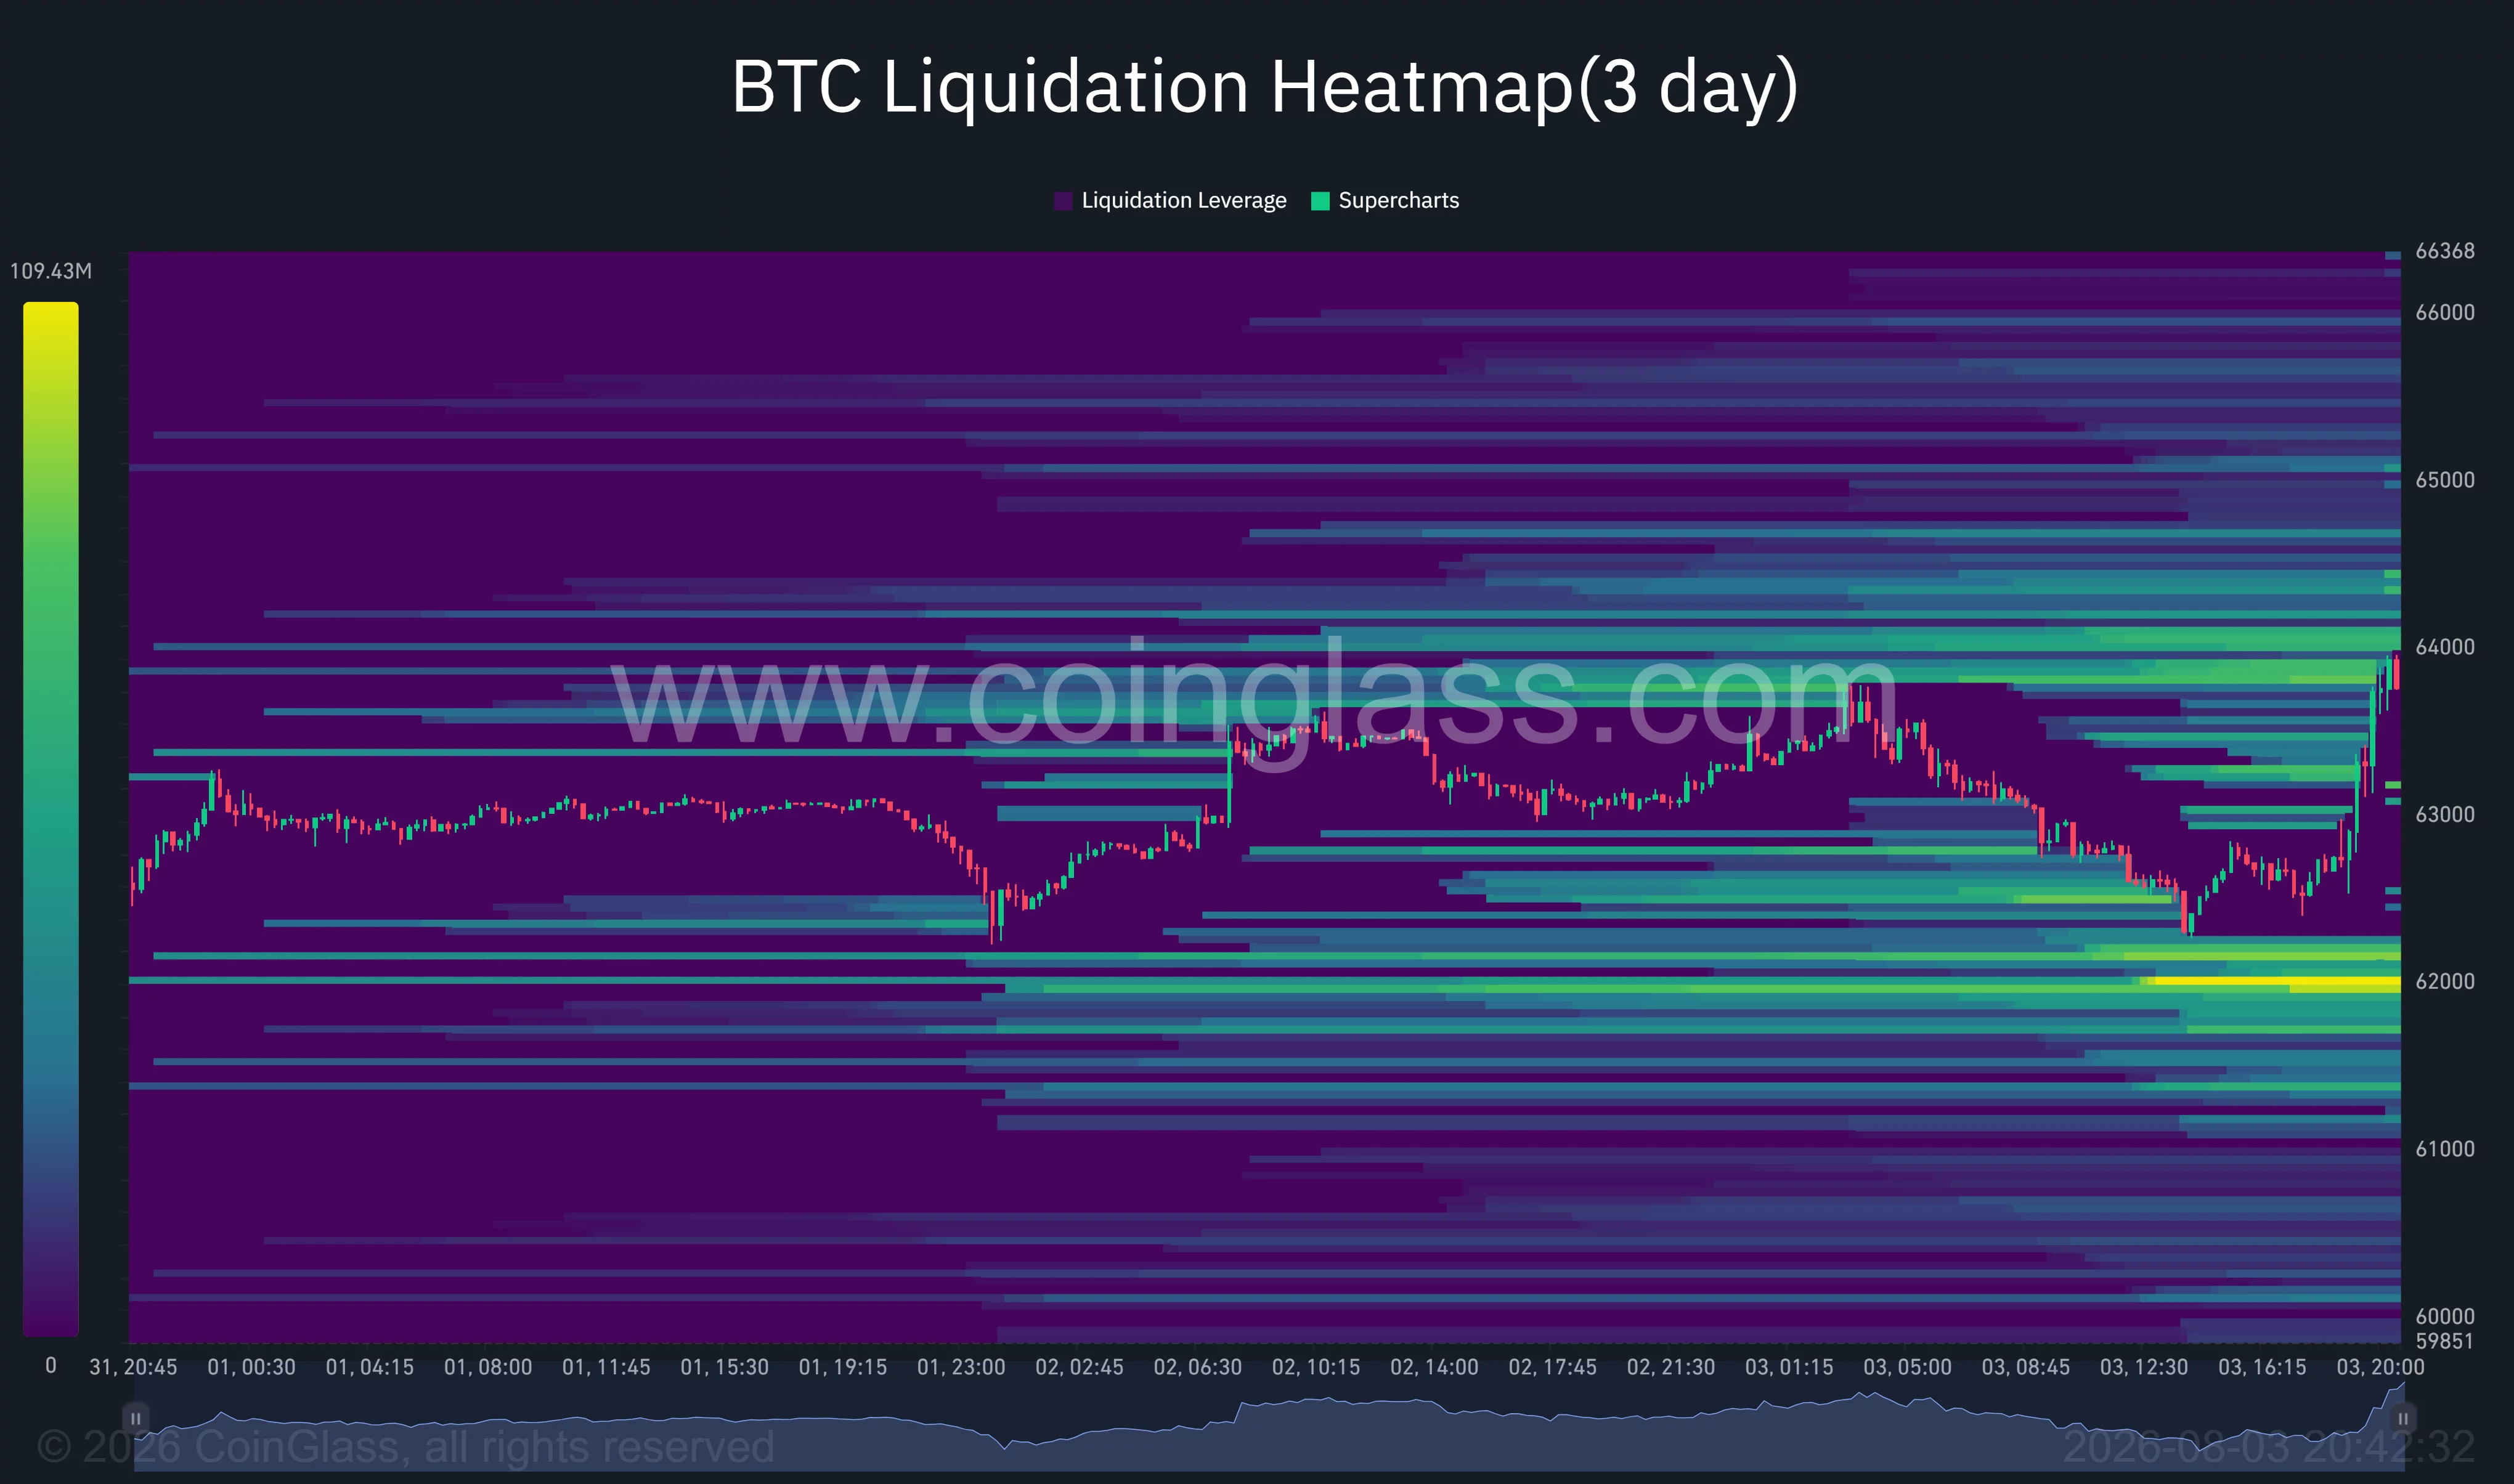
The closest upside cluster sits between roughly $63,800 and $64,100. Bitcoin’s rebound toward $63,900 has already brought the price into this area, where further gains could force leveraged short positions to close.
Additional liquidity is visible around $64,300, followed by thinner bands near $64,800 and $65,000. A decisive move through $64,100 could therefore accelerate toward the upper clusters, although weak spot buying may limit the size of any short squeeze.
The largest nearby downside concentration is around $61,900 to $62,200. This bright liquidity band sits just below Bitcoin’s latest intraday low and could attract price if the recovery loses momentum.
Bitcoin’s position between these two clusters leaves it vulnerable to sharp moves in either direction. A break above $64,100 could target $65,000, while a decline below $62,000 would put the June–July floor near $57,820 back in view.
Momentum remains neutral despite the rebound
Bitcoin’s daily relative strength index stands at 49.28, slightly below its signal average of 50.87. That reading shows balanced momentum rather than a clear advantage for buyers or sellers.
The MACD is less constructive. Its histogram has turned negative, while the MACD line remains below the signal line. This indicates that the recovery from the late-June low has lost momentum, even though Bitcoin has avoided another major breakdown.
For a stronger bullish reversal, BTC would need to reclaim $64,000 and then clear the July resistance zone between $66,000 and $67,394. The next Fibonacci targets would sit at $70,352 and $73,309.
The bearish scenario would gain traction if Bitcoin closes below $63,183 and subsequently loses $62,000. That would increase the risk of a decline toward $60,000, followed by the broader range floor near $57,820.
US investors will also be watching spot Bitcoin ETF flows for evidence of institutional demand. Glassnode said ETF inflows and trading volumes improved during the past week, providing some support even as spot-market momentum remained weak.
For now, Bitcoin’s rebound has defended near-term support but has not resolved the wider range. The concentration of liquidation leverage on both sides of the price makes $62,000 and $64,100 the main boundaries for the next directional move.
Disclosure: This article does not represent investment advice. The content and materials featured on this page are for educational purposes only.