
Key Takeaways
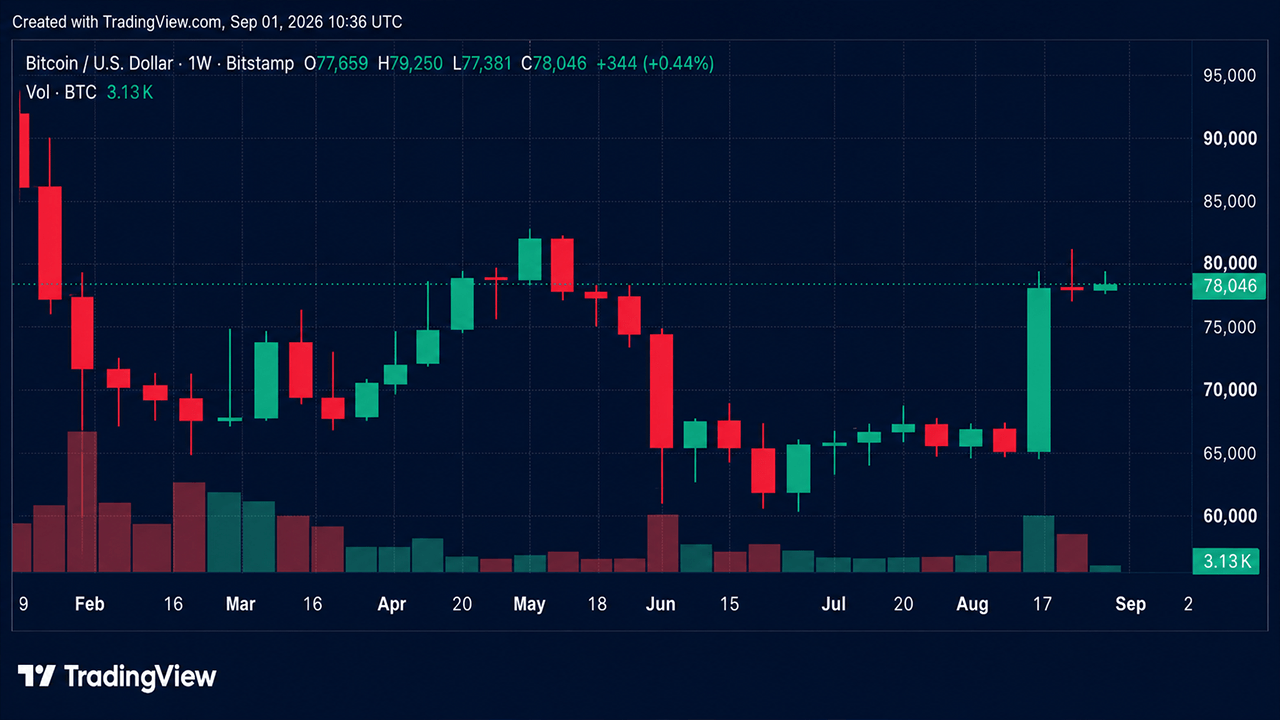
- Bitcoin’s price stood around $77,850 to $78,125 on Sept. 1 as the $77,000 range floor faced another test.
- Market data shows bitcoin’s moving averages flash strong bullish signals, with 14 positive signs and zero negative readings.
- Bitfinex sees $77,100 per bitcoin as key BTC support as markets price a 57% chance of a September Federal Reserve rate hike.
Bitcoin’s 1-Hour Chart Puts $77K Support Back Under Pressure
On Bitstamp’s 1-hour chart, bitcoin’s price range traded near $77,832 per coin after the current candle opened at $77,856, climbed to $77,947, and slipped as low as $77,767. Zooming out slightly on this specific timeframe shows two failed runs toward $80,800-$81,400 since around Aug. 23, along with several wicks into $76,800-$77,200.
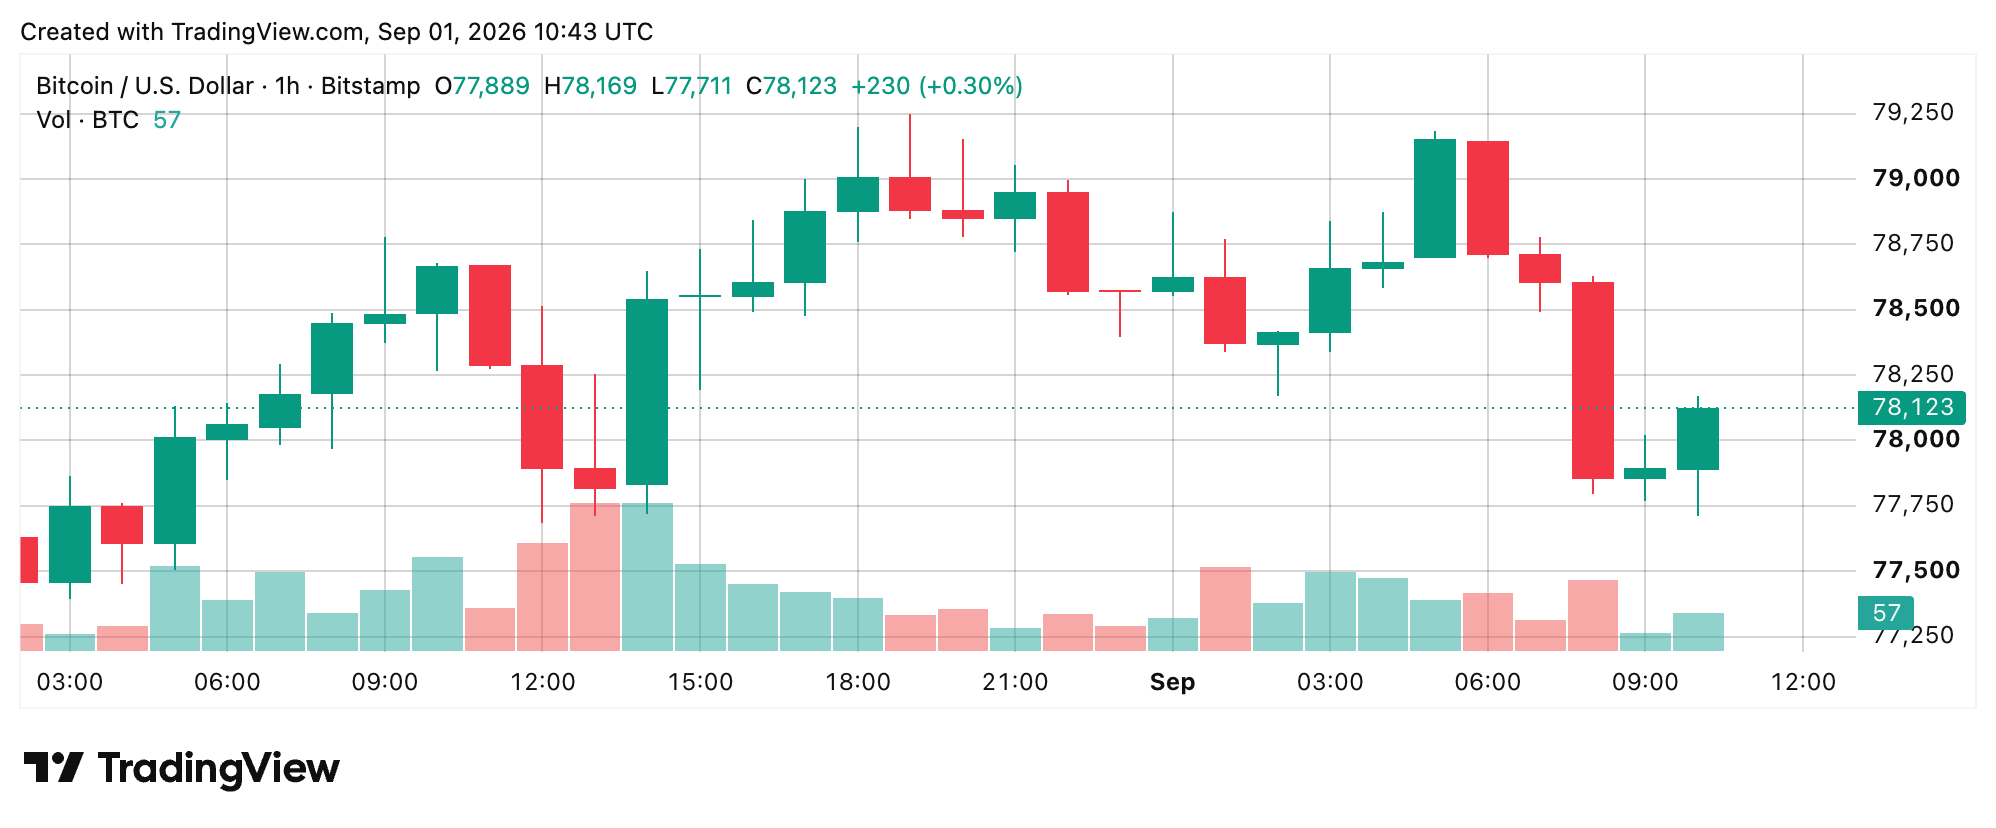
More recently, bitcoin’s price bounced toward $79,200 before sellers pushed it back near the $77,800 range. That puts immediate support at $77,700, followed by $77,000-$77,200, while $79,200-$79,400 remains the resistance zone in the near future.
4-Hour Range Keeps Bitcoin Trapped Between Buyers and Sellers
The broader consolidation is easier to clock on the 4-hour bitcoin price chart. The current candle started at $78,605, briefly reached $78,630, and then dropped to $77,767 before hovering around $77,832, leaving it 0.98% below its opening price. Mid-August’s impulse still dominates the bigger picture, though bitcoin has mostly moved sideways since then.
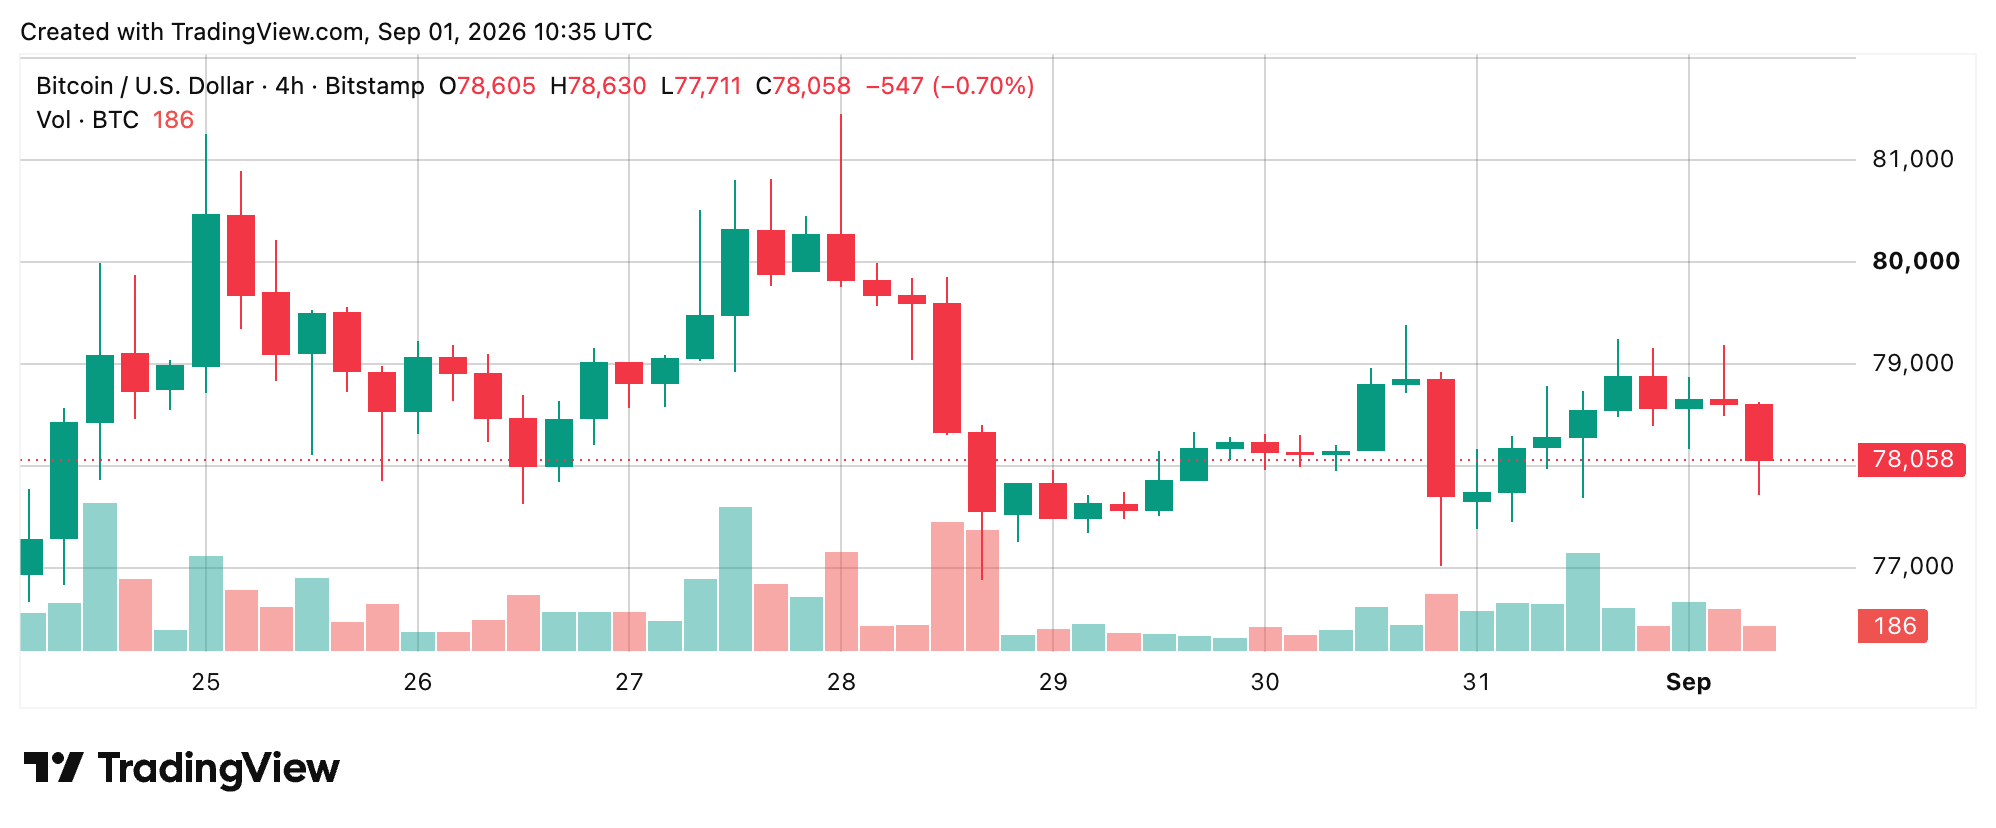
Buyers repeatedly showed up around $77,000-$77,700, with a middle zone around $78,500-$79,000 and a ceiling near $81,200-$81,500. So far, the live candle looks more like another test of the floor than a confirmed breakdown.
Daily Chart Preserves the Bigger Breakout Despite Sept. 1 Drop
Short-term weakness looks less dramatic on bitcoin’s price chart via the 24-hour timeframe. Tuesday’s developing candle opened at $78,571 per coin, pushed up to $79,184, fell to $77,767, and then traded around $77,832, putting it 0.93% below the daily open.
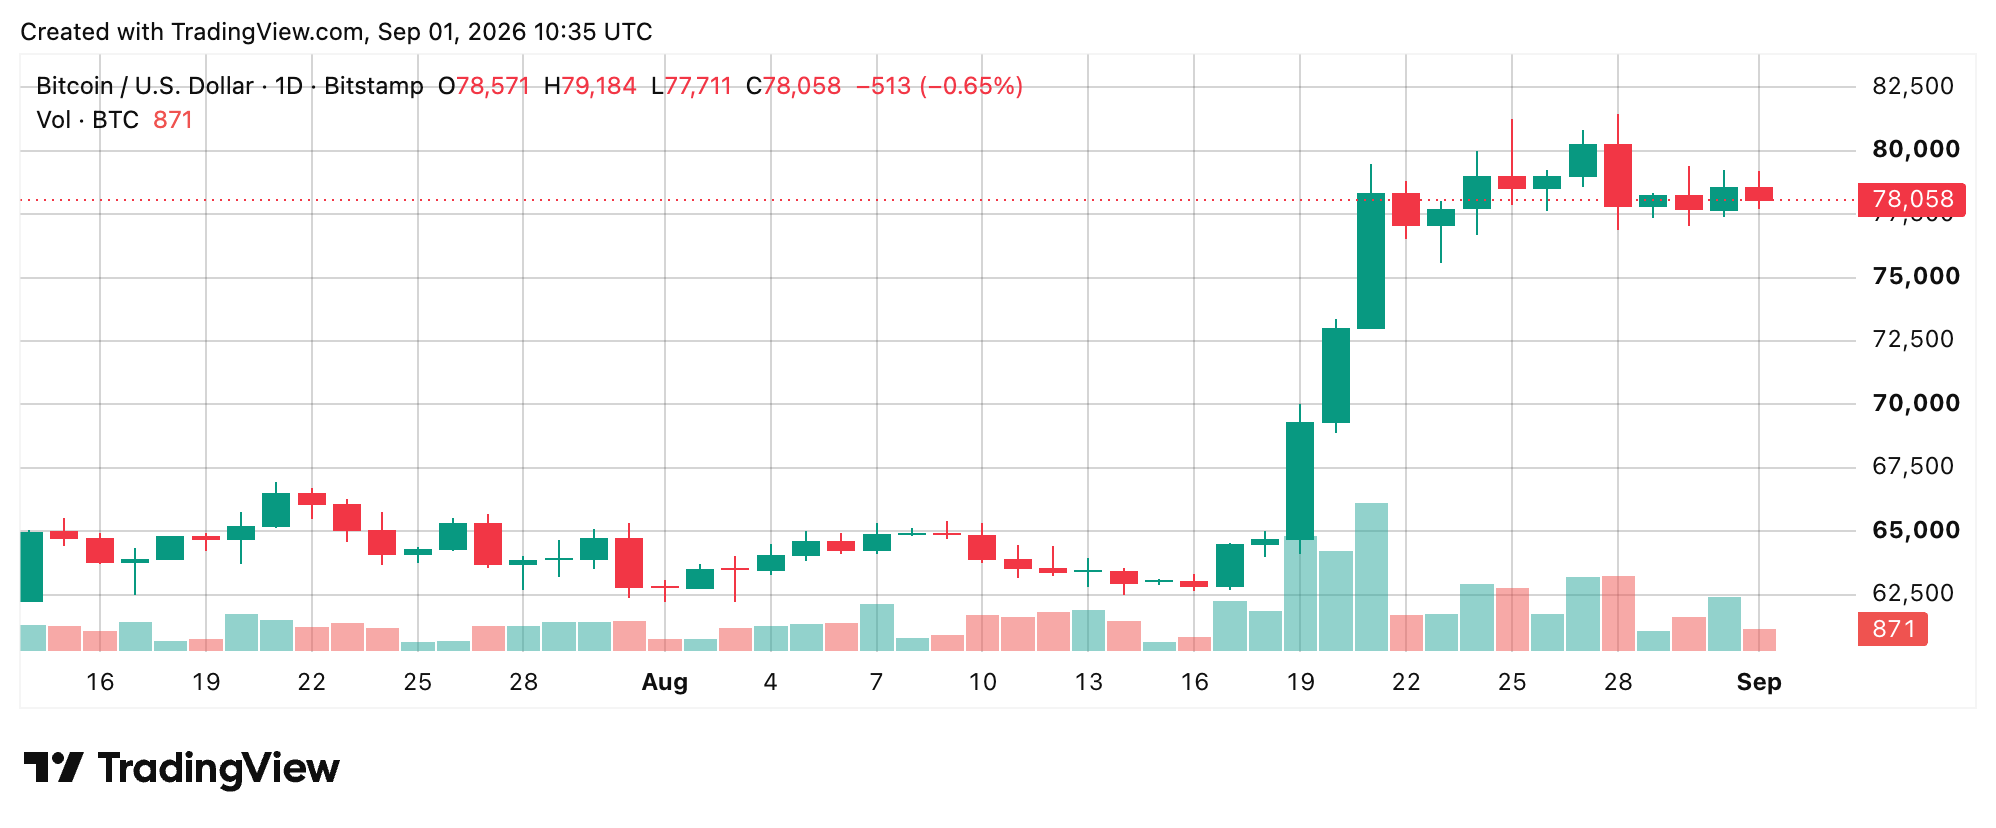
This comes after BTC ran from the mid-$63,000s into the low-$81,000s during late August. Now it is seriously digesting that rally inside a roughly $77,000-$81,500 shelf. Support sits at $77,767 and $77,000, while resistance comes in around $79,184-$79,400, then $81,000-$81,500.
Oscillators Show Momentum Is Elevated, but Not Universally Bullish
Oscillators via the daily chart are giving a more mixed read than other technicals. Most of the group stands in the middle, with nine neutral signals, two bullish signs, and no bearish alerts. The relative strength index (RSI) came in at 72, and the Stochastic at 83, though neither was enough to trigger a bullish signal. CCI at 60, ADX at 44, and the Awesome Oscillator at 9,180 also remain fairly neutral.
The brighter spots on the daily chart with the momentum oscillator at 1,955 and the moving average convergence/divergence (MACD) at 3,720, both flashing positive signals. So there is still some bullish momentum in the air, but it is nowhere near as convincing as what the moving averages are showing.
Moving Averages Keep the Larger Bullish Structure Intact
The daily bitcoin price chart’s moving averages (MAs) still lean heavily bullish, with market data showing 14 bullish signals, one neutral, and zero bearish signals. Most key averages sit well below bitcoin’s current price, including the 20-period exponential moving average (EMA) at $74,505, the 50-period EMA at $70,039, and the 200-period EMA at $72,297. BTC is above every listed average except the 10-period simple moving average (SMA) at $78,591. So while the short term looks shaky, the bigger trend is still holding up.
Bitfinex Says Spot Buying Leaves Room for Bitcoin to Run
In a report shared with Bitcoin.com News, Bitfinex market strategists disclosed that they see another bullish piece in the cards: the latest advance appears to have come more from spot demand than excessive leverage. “We are in a market driven by spot buying and, notwithstanding large short liquidations, open interest has only gradually increased, while basis has remained relatively low and at healthy levels historically,” the analysts told our newsdesk.
Continued spot buying, without open interest suddenly blowing out, matters here. Combined with bitcoin holding $77,100 as support, Bitfinex analysts said the market “does not show any signs of overheating.” That could leave BTC consolidating within its new short-term range or extending the broader uptrend higher. Institutional demand may also be soaking up supply from large holders, giving bitcoin some extra protection against short-term selling.
Custodial balances rose massively during August’s latest advance, closely following ETF inflows even as large holders locked in profits. “While whales took profits during the rally, institutional demand absorbed that supply,” the analysts remarked. Bitcoin flowing into regulated investment vehicles, they argued, may be less vulnerable to sudden liquidation triggered by short-term macro news. That leaves them more confident BTC can consolidate or push higher unless a wider risk-asset selloff pulls the crypto economy down with it.
Ether ETF Demand Offers Another Window Into Crypto Risk Appetite
Bitcoin is only part of what Bitfinex is watching. Ethereum, funnily enough, could become a useful gauge for how willing investors are to take risks as demand for U.S. spot ether exchange-traded funds (ETFs) accelerates. “We believe that ether’s price action could potentially be the proxy for the market’s risk appetite,” the analysts detailed. Nearly 12.3% of all ether ETF inflows since inception came during August, according to their figures. Adjusted for scale, demand over the past week was roughly four times as intense as demand for bitcoin products.
Fed Risk Puts Bitcoin’s $77,100 Floor in the Spotlight
Macro conditions could be the bigger obstacle. Bitfinex analysts noted that markets raised the implied probability of a September Federal Reserve rate increase to 57%, adding pressure on risk assets as short-dated Treasury yields climbed. ETF and stablecoin liquidity can still support crypto prices, but expectations for higher interest rates may put a ceiling on how far this rally runs. August labor market and inflation reports are the next major test, according to the analysts. If crypto inflows stay resilient while tighter monetary policy gets priced in, they said it “would strengthen the case that underlying demand remains intact despite a more restrictive macro backdrop.”
For bitcoin’s price read, the technical and fundamental stories now meet around a few key areas. The immediate downside fight is around $77,000-$77,100, while $79,200-$79,400 is the first serious hurdle above. Hold that floor, and the post-August range stays intact, keeping $81,000-$81,500 within sight. Lose it decisively, though, and BTC would challenge the short-term structure supporting Bitfinex’s spot-demand thesis.
Bull Verdict:
Bitcoin’s price trend still has the upper hand as long as $77,000-$77,100 holds. Spot buying remains healthy, moving averages are firmly bullish and leverage does not look overheated. If that support holds, another push toward $79,400 and possibly $81,000-$81,500 is still in the cards.
Bear Verdict:
Things get shakier if bitcoin’s price loses $77,000 with conviction. That would break the range holding since August and put the bullish setup under real pressure. Momentum is already running hot, and with rate-hike concerns creeping back in, a break below support could turn September’s sideways start into a deeper pullback.