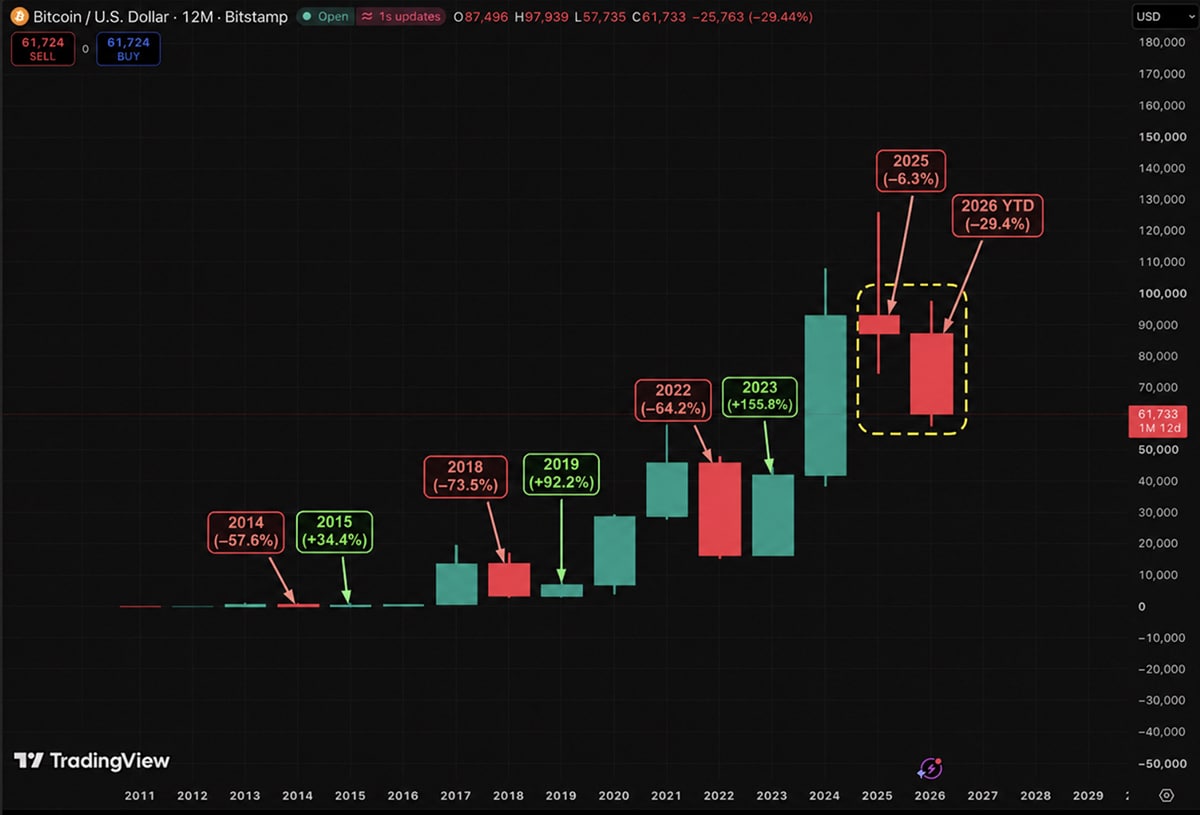
Bitcoin price is heading toward an unprecedented moment in its trading history. Bitcoin has fallen 30% in 2026, following a losing year in 2025. If sellers maintain control through December, BTC will record its first two consecutive negative calendar years.
The pattern has survived every major crypto winter. Bitcoin finished 2014 lower before recovering in 2015. It rebounded in 2019 after the brutal 2018 collapse, then climbed again in 2023 following the FTX-driven crash. This time, however, the recovery has failed to arrive on schedule.
BTC is hovering at the $61,900 level, extending a sharp November selloff. The token has fallen 51% from its October 2025 record near $126,200.
So, is the 4-year cycle broken for the first time?
Bitcoin Price History: Recovery Pattern Under Threat
Bitcoin’s annual performance has been anything but consistent, but its losing years have shared one important characteristic: none has been followed by another annual loss.
In 2014, Bitcoin price dropped 56% before gaining 35% in 2015. The 2018 bear market wiped out 73% of its value, but BTC recovered around 92% the following year.
The same pattern appeared after the 2022 collapse. Bitcoin lost 64% that year, then surged more than 155% in 2023 as investors returned and expectations surrounding spot Bitcoin ETFs grew.

BTC USD, TradingView
Bitcoin also finished 2025 6.3% lower, despite reaching a new all-time high above $126,000 in October. Its current decline puts 2026 on course to extend that losing streak. Bitcoin has also already experienced another post-halving year without delivering the familiar annual rally. The market is approaching December with big losses and weakening momentum.
DISCOVER: 15+ Best Crypto IPO to Watch in 2026
Technical Analysis Points to Further Pressure
The daily chart offers little evidence that sellers have exhausted themselves. Bitcoin trades below its 50-day moving average at $78,200 and its 200-day average around $72,700.
Its 14-day relative strength index has fallen close to 20, firmly inside oversold territory. That reading signals intense selling pressure, and it does not show an immediate reversal.

BTC USD, TradingView
The daily structure also shows lower highs and lower lows. BTC’s decline has pushed it toward the $60,000 region as buyers fail to defend the nearby support.
The first important support zone sits around $60,850, followed by $59,700. A sustained break below those levels could expose Bitcoin to another wave of selling.
On the upside, $64,850 represents an initial resistance level. Reclaiming that area would offer an early indication that buyers are returning, while a move toward $67,200 would provide stronger evidence of recovery.
For now, the gap between Bitcoin market price and its major moving averages highlights how much ground bulls must recover.
DISCOVER: 15+ Upcoming Coinbase Listings to Watch in 2026
Bitcoin’s Four-Year Cycle Finally Breaking?
This Bitcoin price decline challenges the traditional halving cycle. Previous halvings preceded major bull markets, with rallies generally peaking the following year before deep corrections.
The 2024 halving followed that pattern, but the subsequent price action has been far less convincing. Institutional participation, spot ETF demand, and changing macroeconomic conditions have altered the market structure.
The arrival of regulated investment products has brought new sources of demand, but it has not eliminated Bitcoin’s exposure to financial markets. Risk aversion can still trigger rapid withdrawals and aggressive selling.
The next few weeks could carry unusual historical significance. A recovery before year-end would preserve Bitcoin’s record of avoiding consecutive annual losses. Now it looks like another close in negative territory will end that streak for the first time.
Follow 99Bitcoins on X For the Latest Market Updates, and Subscribe on YouTube For Daily Expert Market Analysis.
The post Bitcoin Price Has Never Had Two Red Years in a Row: 4-Year Cycle Broken? appeared first on 99Bitcoins.